Greenhouse gas emissions
Climate change is caused by increasing levels of atmospheric greenhouse gases (GHGs), such as carbon dioxide, methane and nitrous oxide. GHGs trap heat from the sun and make Earth warmer. GHG emissions from human activities, such as burning oil, gas and coal, increase the amount of heat energy trapped near the Earth’s surface. You can find out more about GHGs on NIWA’s website: Climate change: the science | NIWA.
The two GHGs emitted most in Aotearoa New Zealand are:
- carbon dioxide (mostly from transport, manufacturing, construction and energy)
- methane (mostly from livestock and waste).
How we track emissions
In order to monitor our progress towards our climate action targets, we need to measure our greenhouse gas emissions so we can see how they change over time. We measure our corporate emissisions – which includes the emissions generated by our services and facilities, as well as our districtwide emissions.
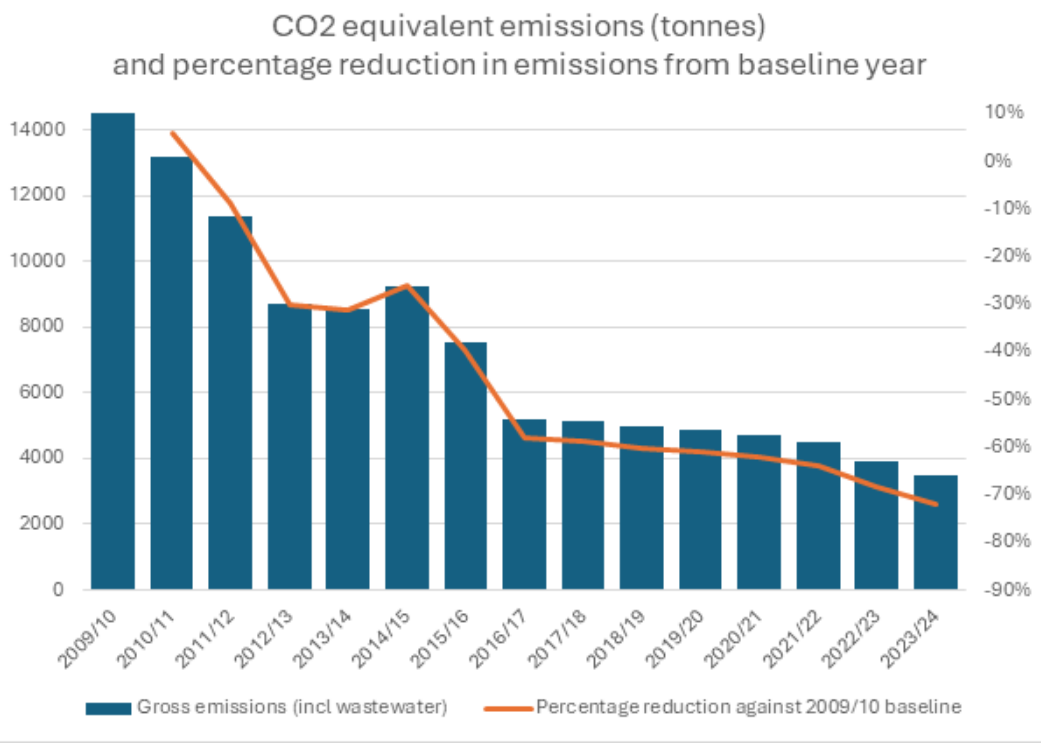
Council started measuring its organisational emissions in 2010, and was one of the first councils in New Zealand to do so. Our performance is independently audited and verified through the Toitū Carbon Reduce certification. We’ve reduced our corporate emissions by 72% since 2010.
GHG emissions for the Kāpiti Coast district are measured as part of Greater Wellington Regional Council’s regional emissions inventory using the Global Protocol for Community-Scale (GPC) Greenhouse Gas Emissions Inventory. Emissions across the Kāpiti District have reduced 6% since the first regional emissions inventory was undertaken in 2018/19.
Greenhouse gases and carbon accounting
Carbon accounting best practice is to measure GHG emissions by tonnes of carbon dioxide equivalent (tCO2-e). This is a useful way of comparing emission profiles, especially as they may include different types of GHGs. For more information about carbon accounting, see: Aotearoa’s contributions to greenhouse gas emissions (video) – Science Learning Hub
Aotearoa New Zealand’s emissions
Emissions from Aotearoa New Zealand are relatively small on a global scale, but our per capita emissions are among the highest in the world. To address climate change, we need to reduce emissions at all levels, including households and businesses. Everyone has a role to play.
You can find out more about New Zealand's greenhouse emissions at Stats NZ and New Zealand's greenhouse gas inventory at the Ministry for the Environment's website.
Targets
Aotearoa New Zealand’s national emission reduction targets are:
- net zero emissions of all greenhouse gases other than biogenic methane by 2050
- 24–47% reduction of biogenic methane emissions by 2050, with a 10% reduction by 2030 (relative to 2017 levels).
You can find out more about Greenhouse gas emissions targets and reporting on the Ministry for the Environment's website.
Emissions in Kāpiti
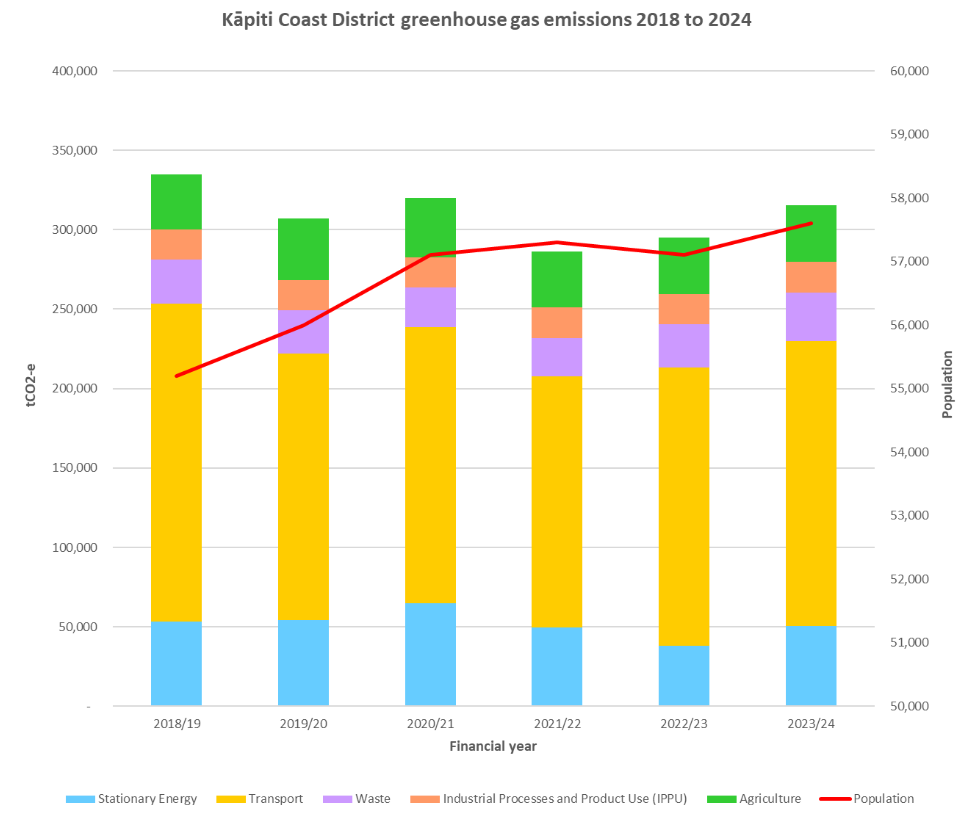
Emissions across the Kāpiti district have reduced 6% since the first regional emissions inventory was undertaken in 2018/19, even with population growth over this period. More than half of the Kāpiti district’s emissions come from transport (57%).
The significant dip in emissions in 2021 and 2022 is partially because of reduced travel and economic activity during Covid-19 lockdowns.
Where do our emissions come from?
-
Transport (57%): Petrol and diesel from land transport, plus aviation, marine and rail fuel. Cars, trucks and buses are responsible for 41% of total district emissions.
-
Stationary energy (17%): Electricity and natural gas used in homes and businesses. In New Zealand, most electricity (approximately 85%) is generated from renewables, with the rest from fossil fuels. The ‘emissions intensity’ of our electricity fluctuates each year depending on the amount of renewable generation in the national grid.
-
Waste (9%): Landfill waste creates methane through anaerobic decomposition. Wastewater processing also generates emissions.
-
Industrial processes (5%): Many refrigerants and solvents are greenhouse gases.
-
Agriculture (12%): Cattle and sheep emit methane as part of their digestive processes. Emissions also come from fertiliser use and manure.
How we compare with others
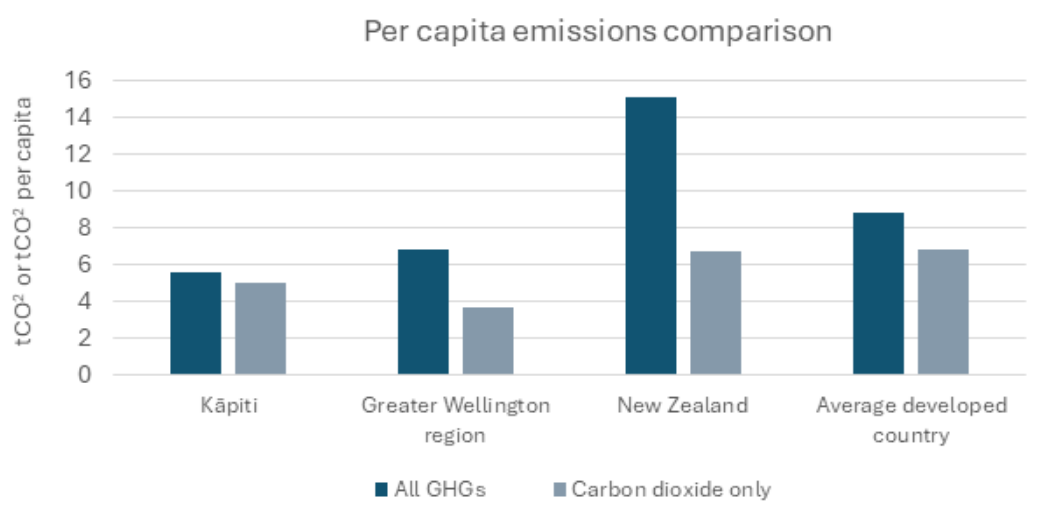
The average Kāpiti resident emits around 5.6 tCO2e each year of all greenhouse gases. This is lower than the per capita average for the Greater Wellington region and New Zealand (6.8t and 15t respectively).
The difference reflects the relatively low levels of agricultural emissions in Kāpiti (12% of total), whereas 53% of New Zealand’s total emissions come from agriculture. If we look at carbon dioxide (CO2) only, per capita CO2 emissions in Kāpiti (5.0t) are higher than the Greater Wellington region (3.6t) average, but still below the New Zealand average (6.7t).
Emissions across the Kāpiti district are measured as part of Greater Wellington Regional Council’s regional emissions inventory. For more information, see Greater Wellington —, see Greater Wellington — Regional emissions monitoring.
Targets
Council has set an aspirational goal to reduce Kāpiti district emissions to net zero by 2040. ‘Net zero’ means reducing emissions as close to zero as possible, and ‘offsetting’ any remaining emissions through carbon sequestration, such as planting trees.
For more information about what Council is doing to reduce emissions, see: What we're doing - Kāpiti Coast District Council.
Council has received a number of awards for reducing its emissions, including being named top carbon reducer in Toitū Envirocare’s 2020 rankings.
Independent verification
Our emissions inventories are independently audited and verified every year under Toitū Envirocare’s CarbonReduce programme. To receive CarbonReduce certification, organisations must:
- Accurately measure and report their GHG emissions. For Council, this includes operational emissions from water and wastewater treatment, roading, pools, vehicles, business travel, fuel and electricity, paper, and waste.
- Develop and implement plans to manage and reduce these emissions.
Independent audit and verification is an important part of Council’s commitment to demonstrating climate leadership and being transparent to the community.
All of Council’s verified emission inventories can be found at Greenhouse gas (GHG) emissions reports.
Targets
In 2023, Council adopted two new targets in line with Toitū requirements and best practice:
- a long-term aspirational target of net zero emissions by 2040
- a mid-term ‘further reductions’ target to reduce our category 1 and 2 emissions by a further 15.5% by 2032 (from a 2021/22 baseline).
The emissions categories are:
- Category 1: direct emissions, such as Council fuel use.
- Category 2: indirect energy emissions from electricity.
- Category 3–6: indirect value chain emissions from the products and services that Council purchases, and from the projects delivered by Council’s suppliers, such as constructing new roads and reservoirs.
Action we’re taking
We’ve taken a range of actions to reduce our emissions, many of which also lowered Council’s operational costs by improving energy efficiency. These actions include:
- replacing diesel with woodchip fuel at our Wastewater Treatment Plant drier, and undertaking a range of Wastewater Plant energy efficiency improvements, including new aerators, clarifier refurbishments and a sand filter replacement
- incorporating energy efficiency in the design of two large construction projects, the Aquatic Centre and the Civic Building
- installing Solar PV panels at some of our facilities
- installing LED streetlights across the district
- replacing end-of-life vehicles with more fuel-efficient or electric vehicles.
In 2023, Council adopted a new emissions reduction plan to meet its 2032 target. For more information about what Council is doing to reduce emissions, see: What we're doing - Kāpiti Coast District Council.
Our changing footprint
As science and accounting best practice evolves over time, we'll need to update our emissions reporting methodology. Key changes to Council's reporting include:
- · From 2018/19, Council was required to estimate wastewater process emissions using the Water NZ model. For consistency, we've backdated these emissions to our original 2009/10 baseline (noting these are estimates only).
- · In 2022, Toitū Envirocare introduced additional CarbonReduce requirements for category 3-6 (indirect) emission reporting. We are currently working to better understand our suppliers’ emissions, before we set a target and a plan to reduce these emissions. This focus on ‘indirect’ emissions may mean that Council’s future inventories have large increases in total emissions.